5 Open Source Alternatives To Datadog
The best Observability and monitoring, Database, and Developer Tools tools similar to Datadog
Grafana stands out as a leading open-source alternative to Datadog. For those seeking different features or workflows, we've curated a comprehensive list of Datadog alternatives, each offering unique strengths.
Notable mentions in the Datadog alternative space include: Prometheus, ThingsBoard, Netdata, Signoz.
The Datadog ecosystem primarily consists of Observability and monitoring solutions, with additional options in Database, Developer Tools. Explore these alternatives to discover tools that align with your specific Datadog-related requirements, whether you're looking for enhanced features, different user experiences, or specialized functionalities.
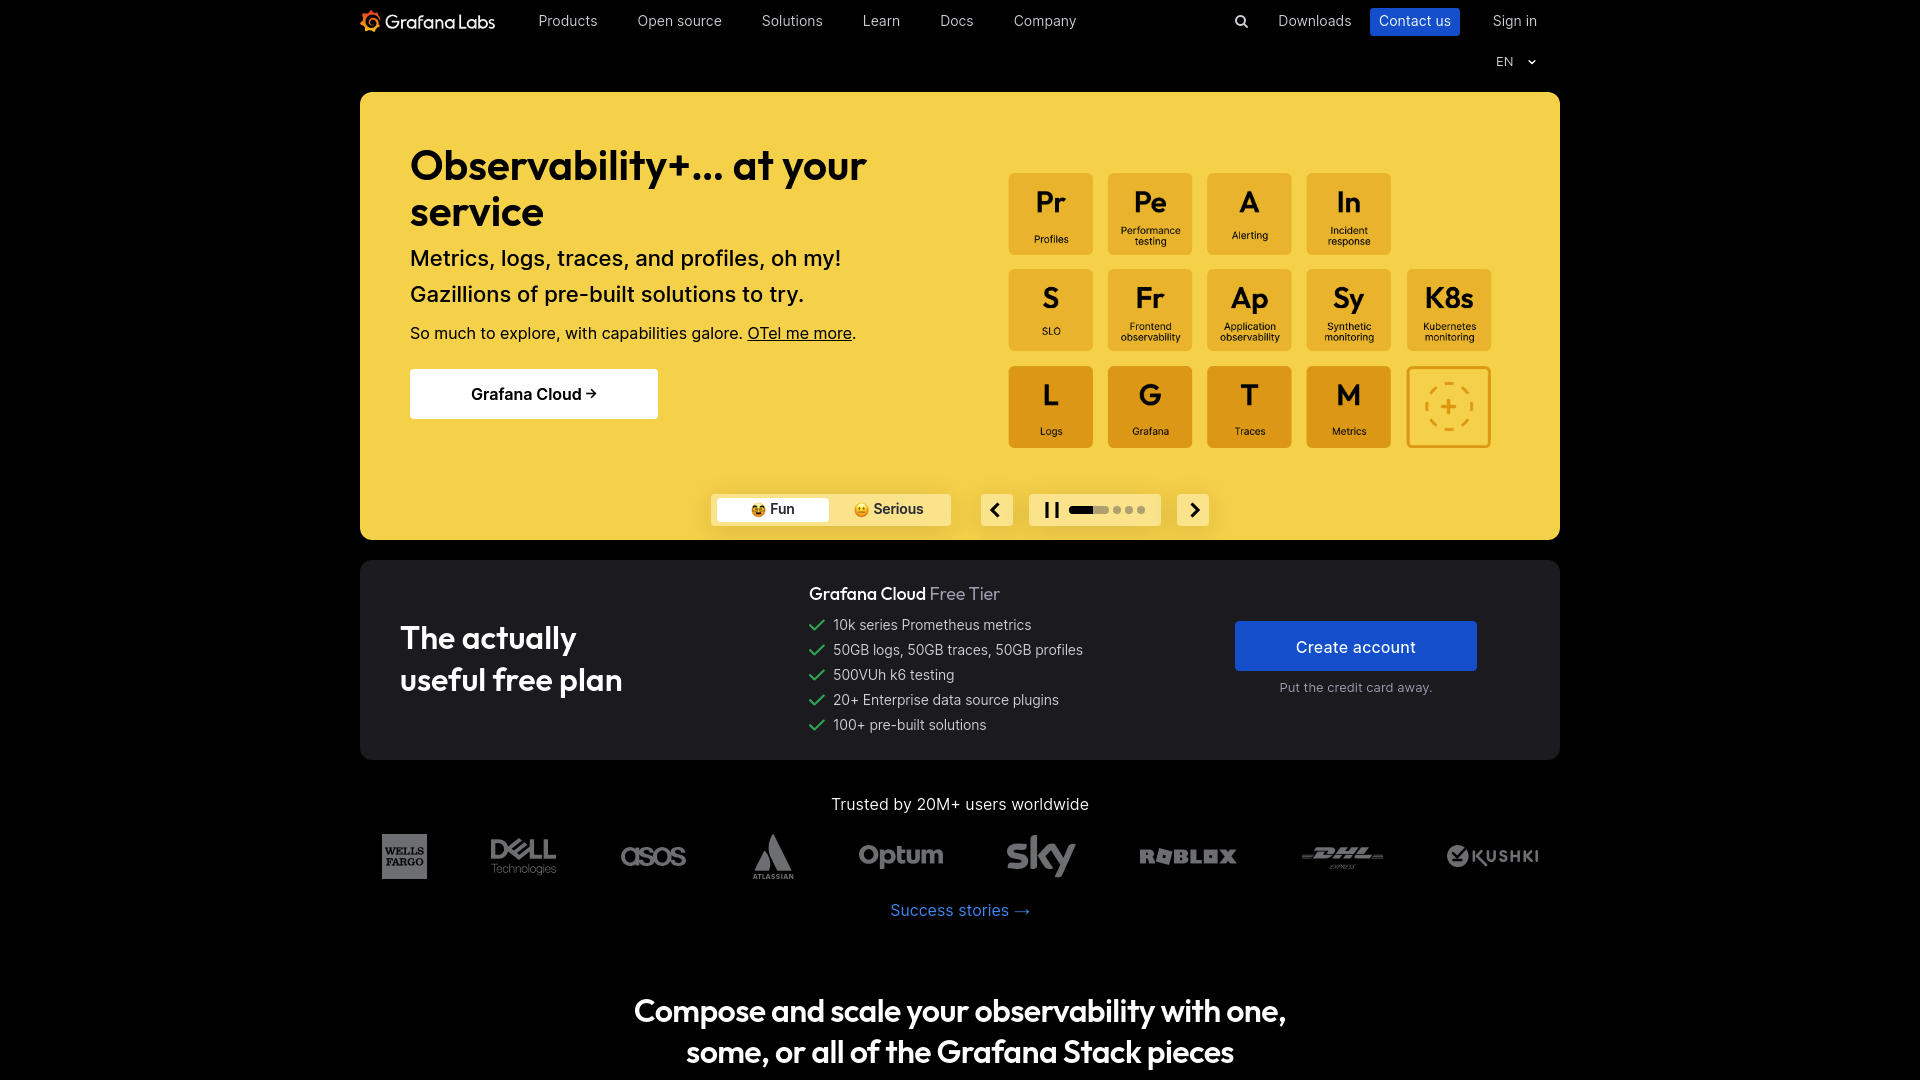
Grafana is an open-source, composable observability and data visualization platform that allows you to query, visualize, and alert on metrics, logs, and traces from multiple data sources. It integrates seamlessly with a wide array of backends like Prometheus, Loki, Elasticsearch, InfluxDB, and Postgres, among others, enabling a unified view of your entire stack.
- Metrics Visualization: Query and visualize metrics from sources like Prometheus and Graphite.
- Log Aggregation: Aggregate and search logs with Grafana Loki.
- Tracing: Distributed tracing with Grafana Tempo.
- Dashboarding: Create and share customizable dashboards.
- Alerting: Set up and manage alerts to stay ahead of issues.
- Plugins: Extend Grafana’s capabilities with a wide variety of plugins.
- Synthetic Monitoring: Monitor API and web application performance.
- Continuous Profiling: Profile application performance with Grafana Pyroscope.
- Incident Management: Manage incidents with Grafana OnCall and Grafana Incident.
- Frontend Observability: Gain insights into frontend performance with Grafana Faro.
Grafana’s flexibility and wide range of integrations make it an indispensable tool for modern observability, catering to both small teams and large enterprises.
Prometheus is an open-source monitoring system and time series database designed to power your metrics and alerting needs. It offers a powerful and flexible platform for collecting and querying time series data, enabling you to gain valuable insights into your systems and applications.
- Dimensional data: Prometheus implements a highly dimensional data model. Time series are identified by a metric name and a set of key-value pairs.
- Powerful queries: PromQL allows slicing and dicing of collected time series data in order to generate ad-hoc graphs, tables, and alerts.
- Great visualization: Prometheus has multiple modes for visualizing data: a built-in expression browser, Grafana integration, and a console template language.
- Efficient storage: Prometheus stores time series in memory and on local disk in an efficient custom format. Scaling is achieved by functional sharding and federation.
- Simple operation: Each server is independent for reliability, relying only on local storage. Written in Go, all binaries are statically linked and easy to deploy.
- Precise alerting: Alerts are defined based on Prometheus's flexible PromQL and maintain dimensional information. An alertmanager handles notifications and silencing.
- Many client libraries: Client libraries allow easy instrumentation of services. Over ten languages are supported already and custom libraries are easy to implement.
- Many integrations: Existing exporters allow bridging of third-party data into Prometheus. Examples include system statistics, as well as Docker, HAProxy, StatsD, and JMX metrics.
Prometheus is 100% open source and community-driven. All components are available under the Apache 2 License on GitHub. It is a Cloud Native Computing Foundation graduated project, ensuring a robust and well-supported ecosystem.
ThingsBoard is an open-source IoT platform designed for device management, data collection, processing, and visualization. It supports industry-standard IoT protocols such as MQTT, CoAP, and HTTP, and can be deployed both on-premises and in the cloud. The platform is known for its scalability, fault-tolerance, and high performance, ensuring that you never lose your data.
- Device Management: Register and manage devices, monitor client-side and provision server-side attributes, and send RPC commands.
- Data Collection: Collect and store telemetry data reliably, even during network and hardware failures.
- Data Visualization: Create rich IoT dashboards with over 30 customizable widgets for real-time data visualization and remote device control.
- Rule Engine: Define complex rule chains to process incoming data, trigger alarms, and integrate with external systems.
- Multi-tenancy: Support for multi-tenant installations, allowing multiple administrators and millions of devices and customers.
- Security: Transport encryption for MQTT and HTTP(s) protocols, device authentication, and credentials management.
- Customization: Extend platform functionality with customizable rule chains, widgets, and transport implementations.
- Fault-tolerance: Identical server nodes with automatic failure detection and replacement, ensuring no downtime.
- Horizontal Scalability: Linear increase in supported requests and devices as new servers are added in clustering mode.
- Microservices Architecture: Maximum scalability and fault-tolerance with microservices, also supports monolithic deployment for smaller environments.
ThingsBoard provides a comprehensive solution for various IoT use cases, including smart energy, smart farming, fleet tracking, smart metering, environment monitoring, smart office, water metering, and smart retail. Its open-source nature, licensed under Apache License 2.0, allows for free use in commercial products, and it can be hosted as a SaaS or PaaS solution.
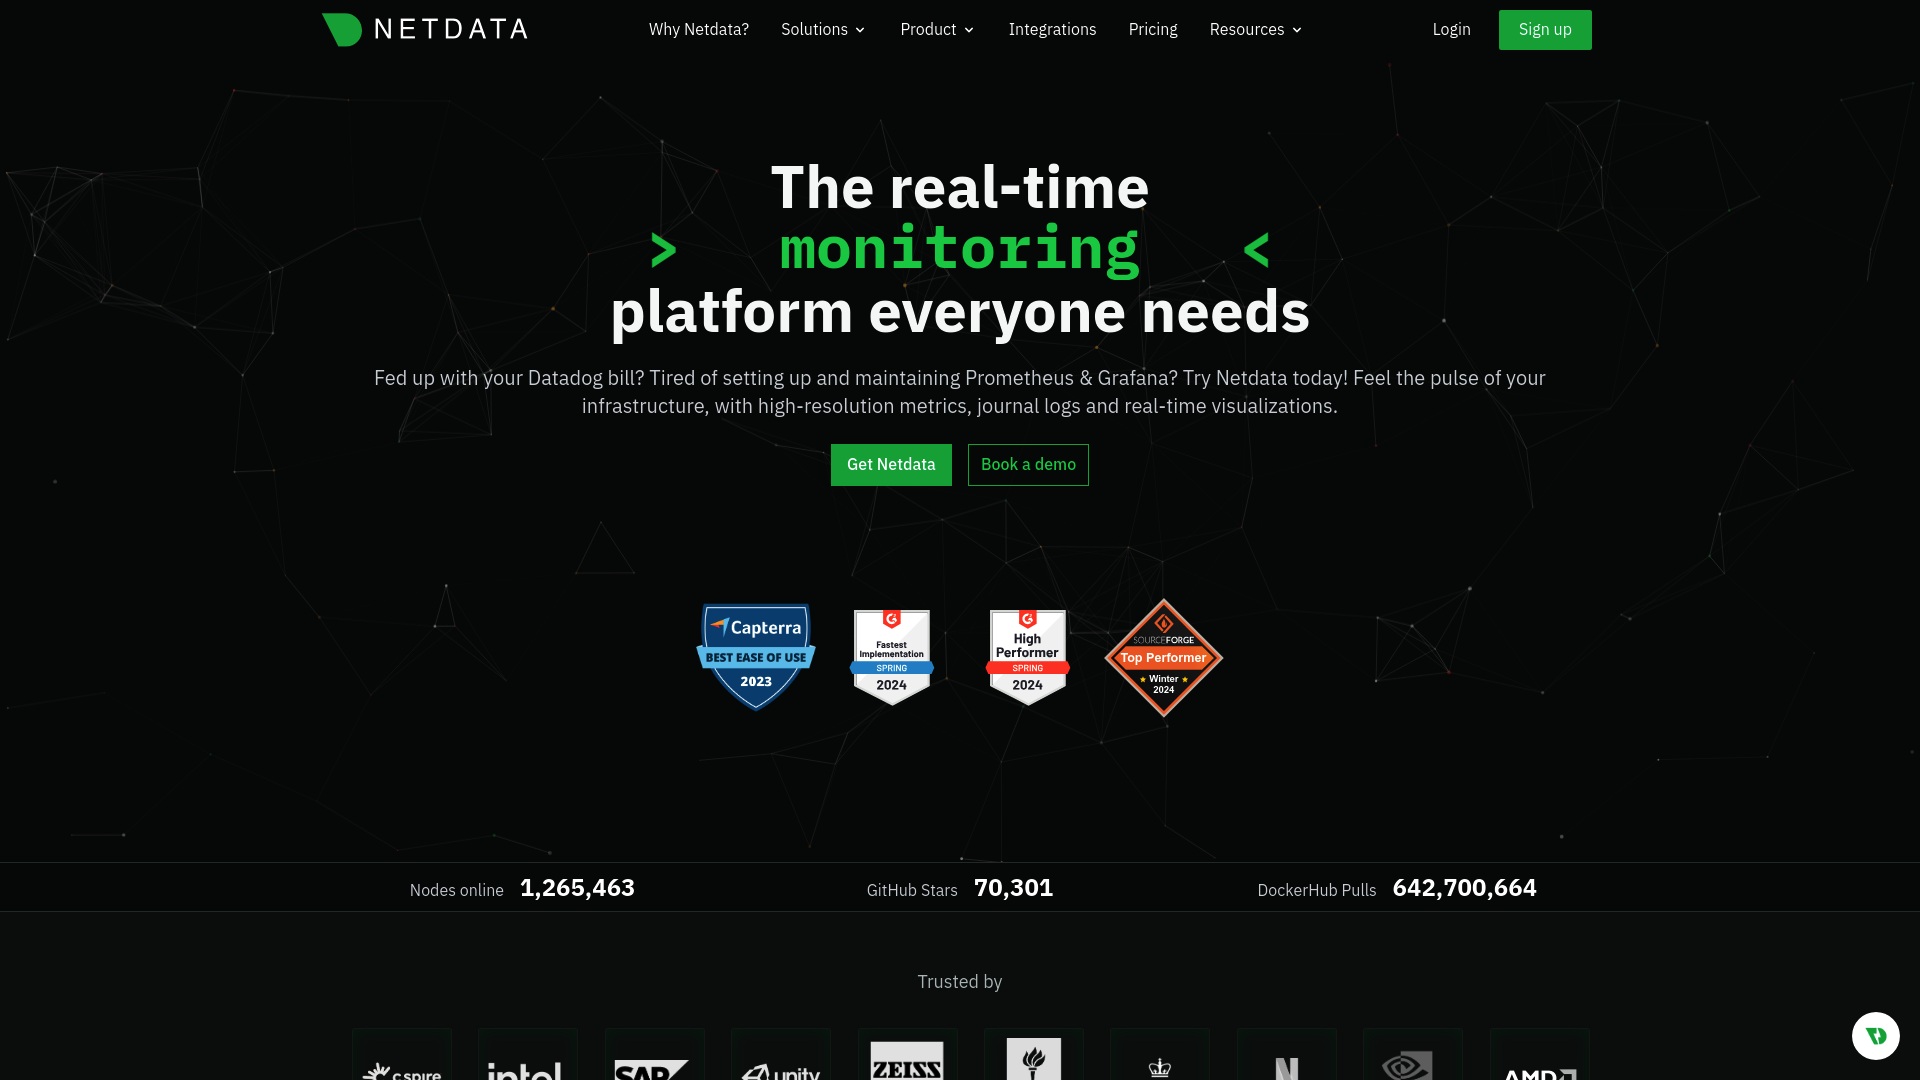
Netdata is a real-time observability, monitoring, and troubleshooting platform designed to simplify and optimize IT operations. It provides high-fidelity data, real-time visualizations, reliable alerts, and anomaly detection for every metric, offering an affordable and out-of-the-box monitoring experience. Netdata's core is open-source, ensuring transparency and flexibility for users. Here’s what makes Netdata exceptional:
- High-Fidelity Data: Collects and visualizes high-resolution metrics in real-time.
- Real-Time Visualizations: Offers interactive charts that update every second, providing immediate insights.
- Reliable Alerts: Automatically sends alerts about anomalous behavior or performance degradation.
- Anomaly Detection: Utilizes machine learning to detect anomalies for every metric.
- Open-Source Core: The Netdata Agent is open-source, encompassing the database, query engine, and more.
- Scalability: Supports both vertical and horizontal scalability, suitable for various environments including on-premises, cloud, and hybrid.
- Easy Installation: Install with a single command and zero configuration, gaining access to thousands of metrics instantly.
- Data Privacy: Ensures that your data is stored on your systems, with ephemeral querying from Netdata Cloud.
- Extensive Integrations: Integrates with hundreds of systems and applications, offering a broad range of data collectors.
Netdata transforms monitoring by providing a comprehensive, easy-to-use solution that delivers real-time insights and reliable performance data, all while maintaining affordability and simplicity.
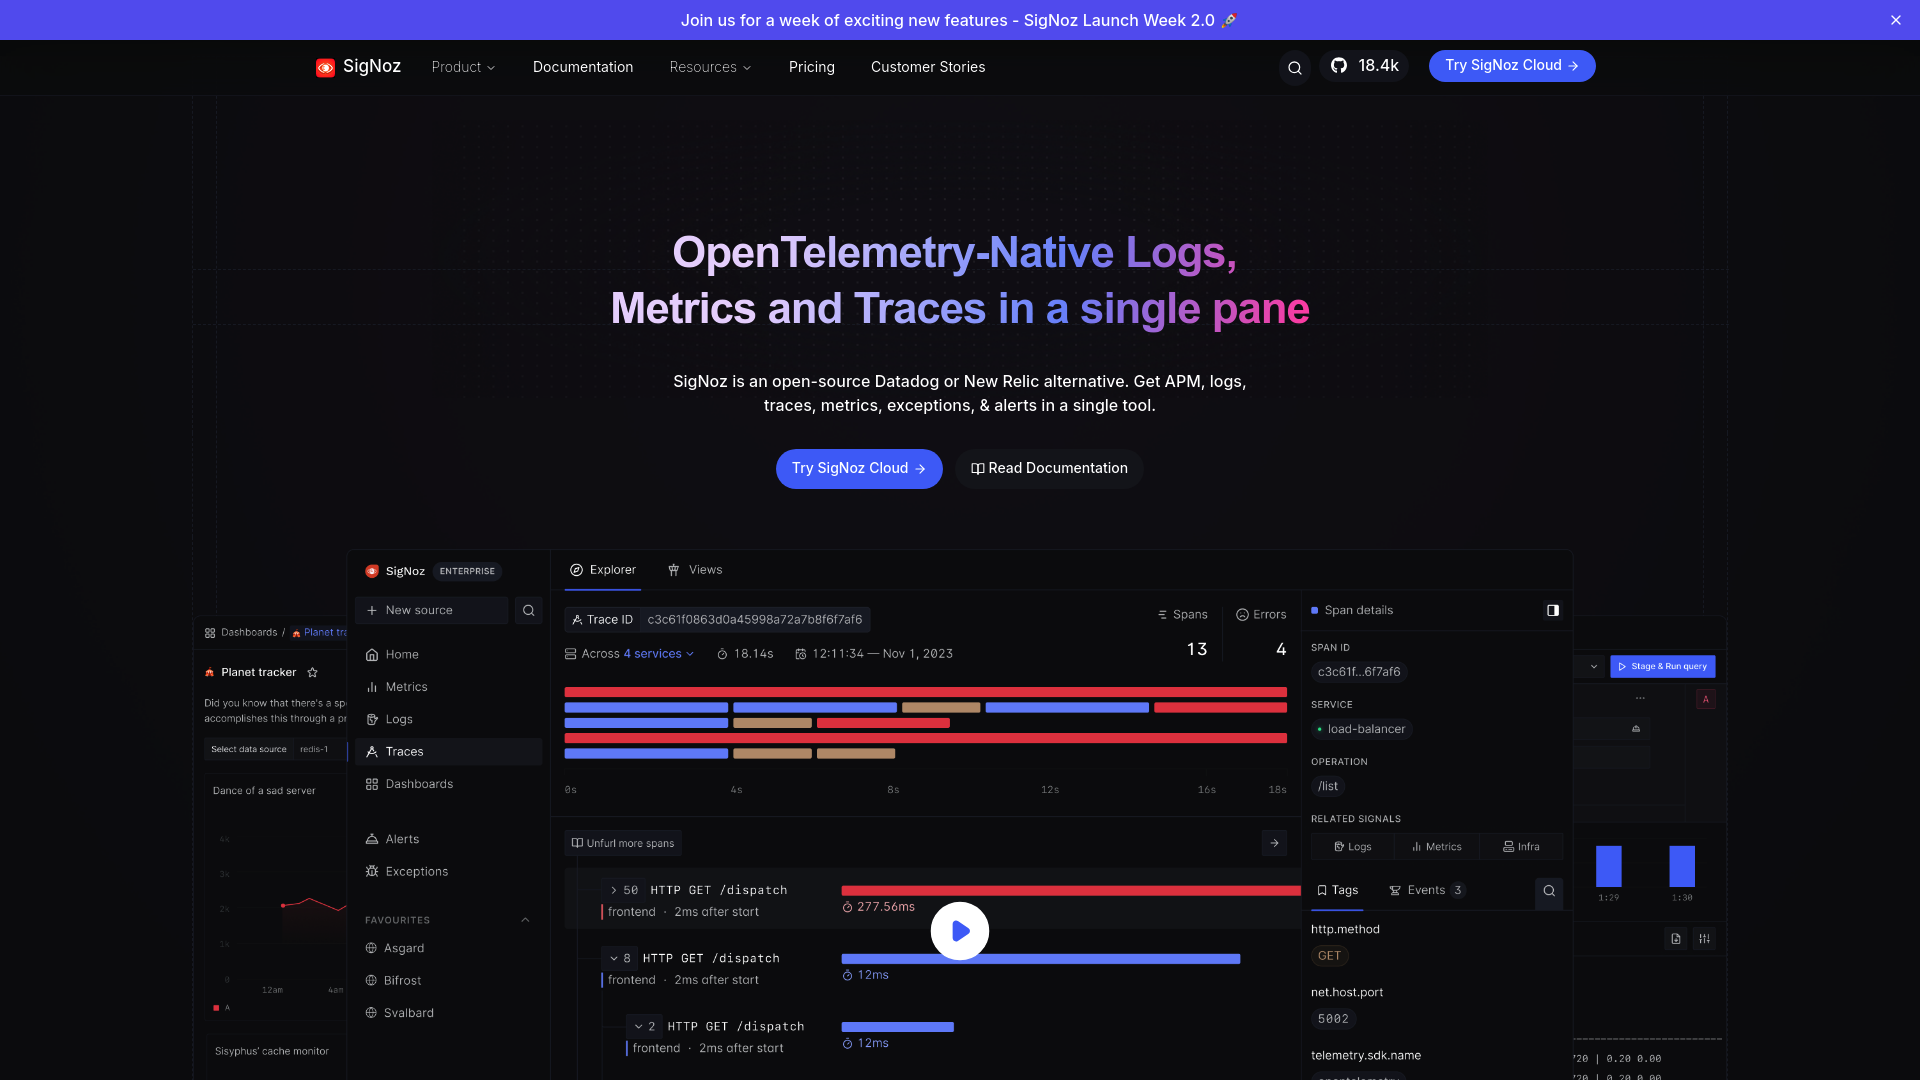
SigNoz is an open-source observability platform designed to provide comprehensive Application Performance Monitoring (APM). It combines logs, traces, metrics, exceptions, and alerts in a single tool, offering a robust alternative to commercial solutions like Datadog and New Relic. SigNoz is built from the ground up to be OpenTelemetry-native, ensuring seamless integration and future-proofing for evolving technologies. You can choose to self-host SigNoz or use its cloud services based on your specific needs.
- Metrics: Track key performance indicators to monitor the health of your applications.
- Traces: Follow requests across various services to identify bottlenecks and performance issues.
- Logs: Aggregate and analyze logs for deeper insights into system behavior and issues.
- Dashboards: Create custom dashboards to visualize metrics, traces, and logs in real-time.
- Errors: Detect and diagnose errors quickly to improve system reliability.
- Alerts: Set up alerts to get notified about critical issues and performance anomalies.
SigNoz leverages ClickHouse, a highly optimized storage solution used by industry giants like Uber and Cloudflare, to ensure fast and efficient data ingestion and querying. Its DIY query builder supports PromQL and ClickHouse queries, providing flexibility for diverse use-cases. With OpenTelemetry’s extensibility, SigNoz offers a standardized approach to observability, eliminating vendor lock-in and enhancing developer productivity. Trusted by teams worldwide, SigNoz is built for scale, capable of handling massive data ingestion while maintaining enterprise-grade security and compliance. Its transparent, usage-based pricing model ensures cost predictability without hidden fees, making it a preferred choice for many organizations.
Discover Open Source Alternatives to:
View allTypeform
Customize your cookie settings for tailored content.
Contentful
NewContentful acquires Ninetailed to boost AI-driven personalization.
1Password
Empower teams with secure access management.
Airtable
Empower teams to create custom apps without coding.
Notion
All-in-one workspace with AI integration.
tableau
Tableau helps people see, understand, and act on data.